FuelPrices
An interactive analytics dashboard that tracks fuel prices across all 51 regions of Greece. Parses official government PDF bulletins daily using AI vision, then visualizes 6+ years of historical data with interactive charts, maps, and leaderboards. Fully static — no backend required at runtime.
Context
The Problem
The Greek government publishes daily fuel price bulletins as PDFs — one per day, per region, going back to 2018. Thousands of files with no API, no structured data, and no way to compare prices across regions or track trends over time.
The Solution
A data pipeline that downloads and parses 2,900+ PDFs using AI vision to extract structured pricing data, then a fully static dashboard that visualizes it all — trend charts, interactive maps, heatmaps, seasonal analysis, and regional leaderboards. No backend at runtime.
Features
AI-Powered Data Extraction
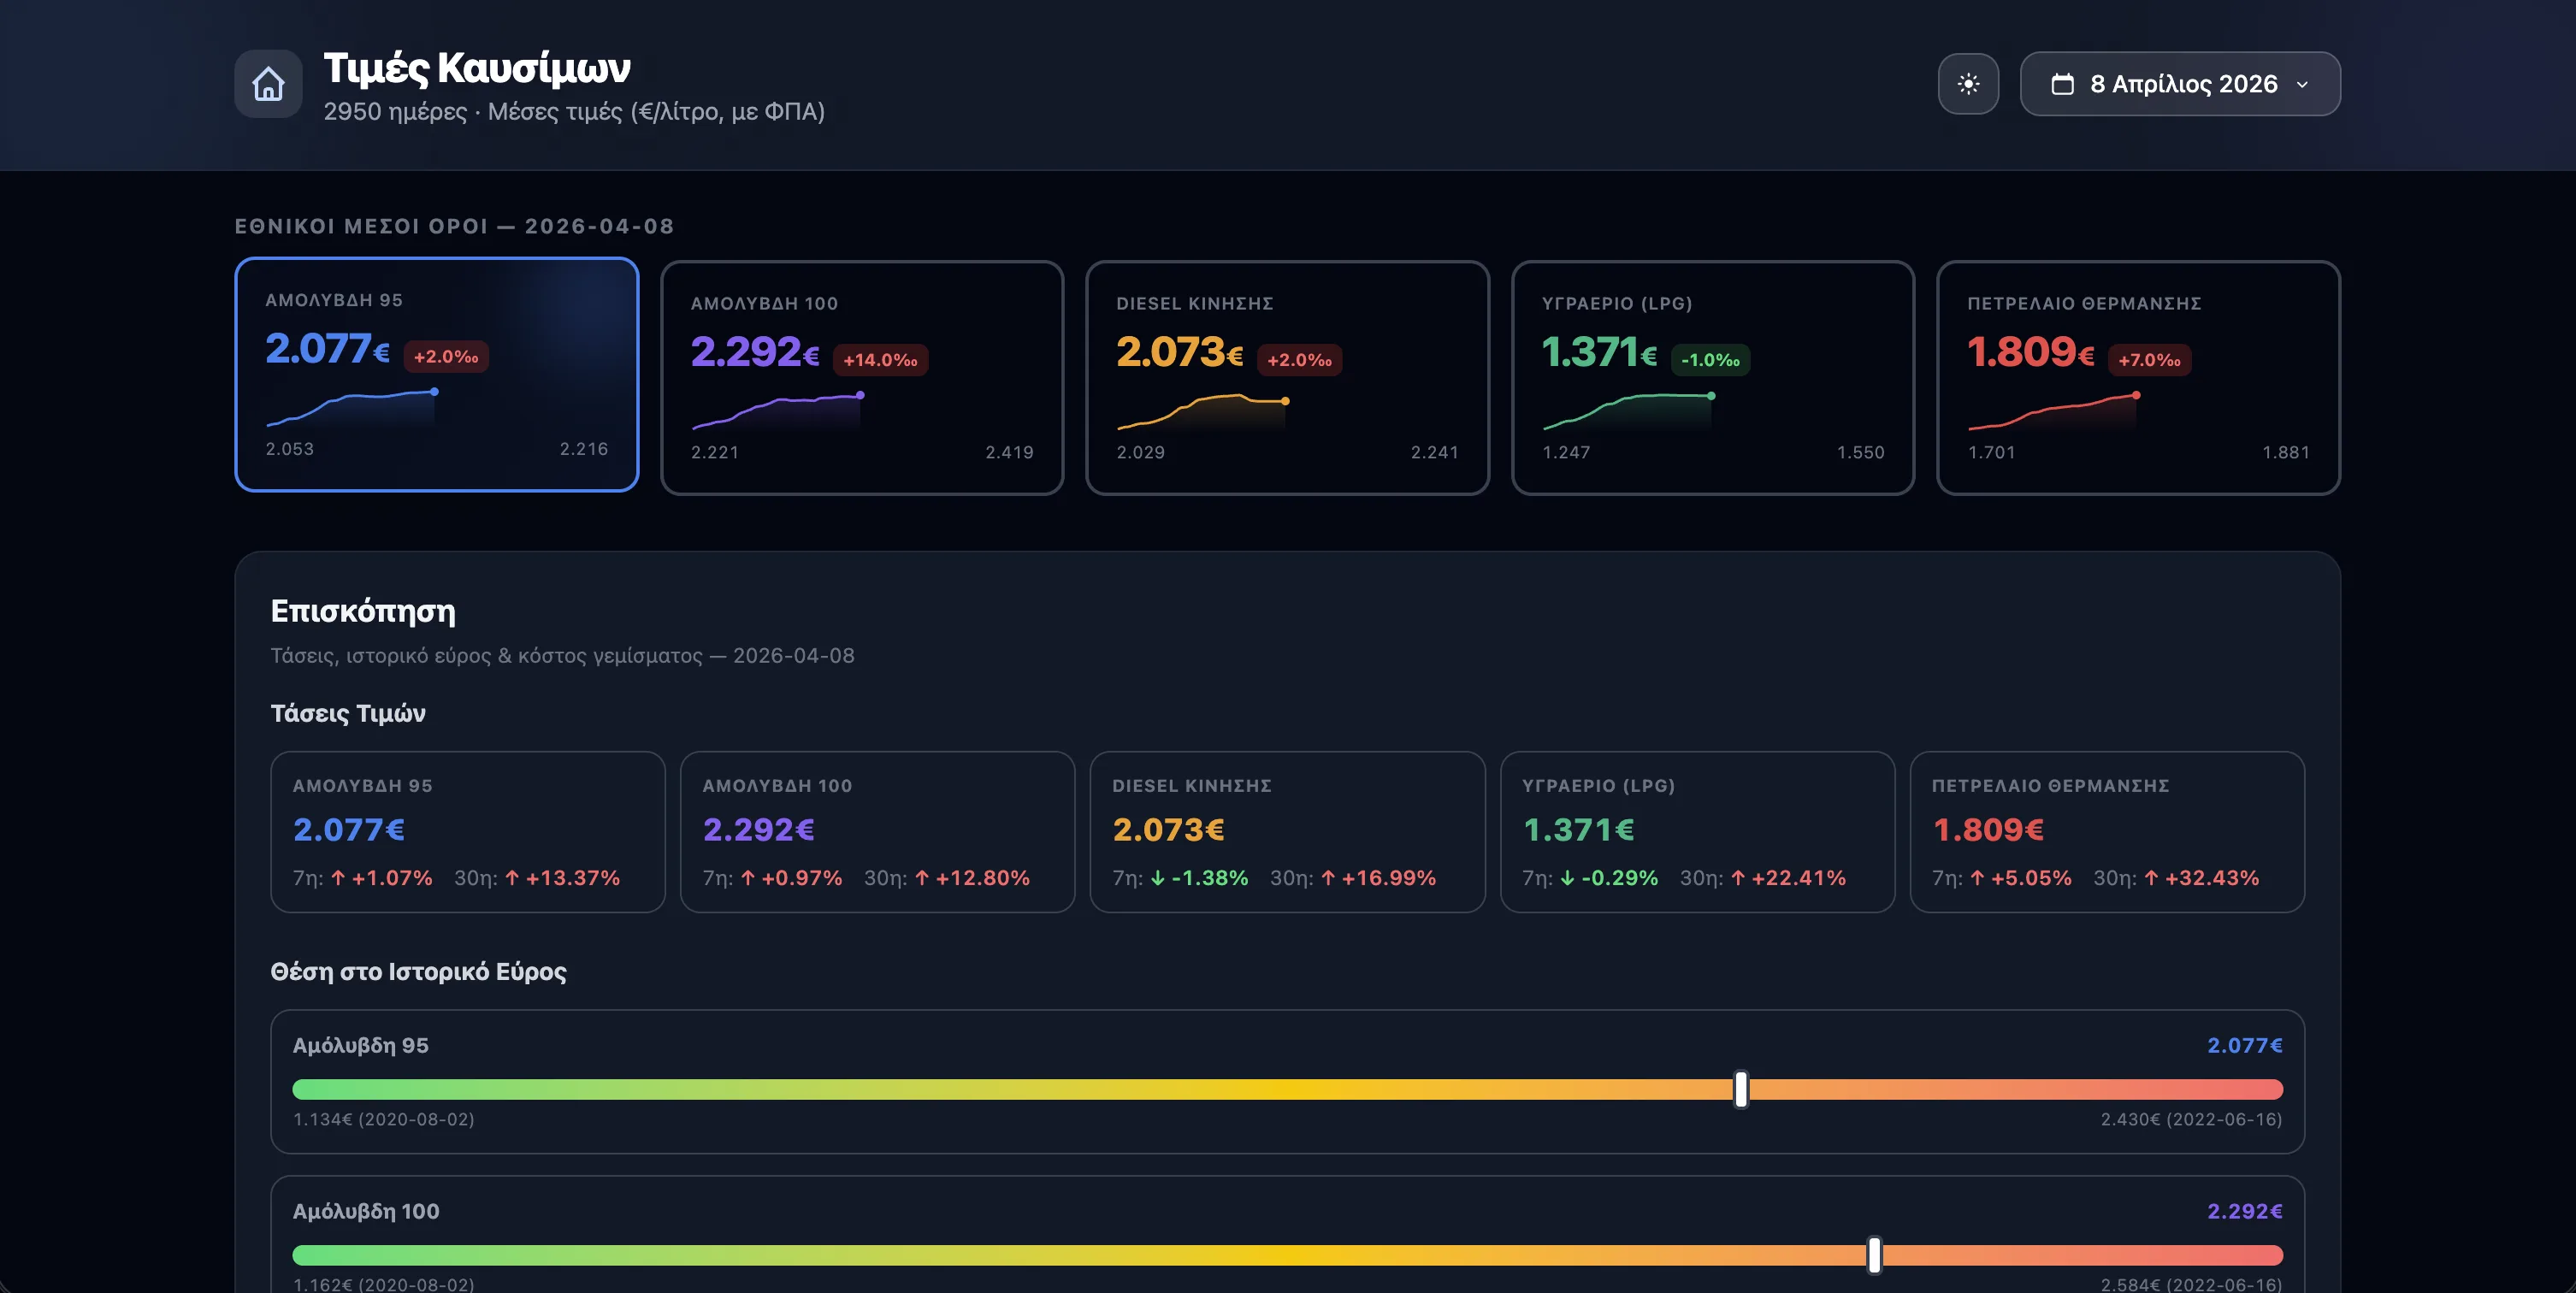
Official government PDFs parsed daily using AI vision to extract structured pricing data across all 51 regions and 5 fuel types.
Interactive Map
Leaflet choropleth map with region circles sized by price deviation from the national average. Color-coded red–yellow–green scale.
Trend Charts with Events
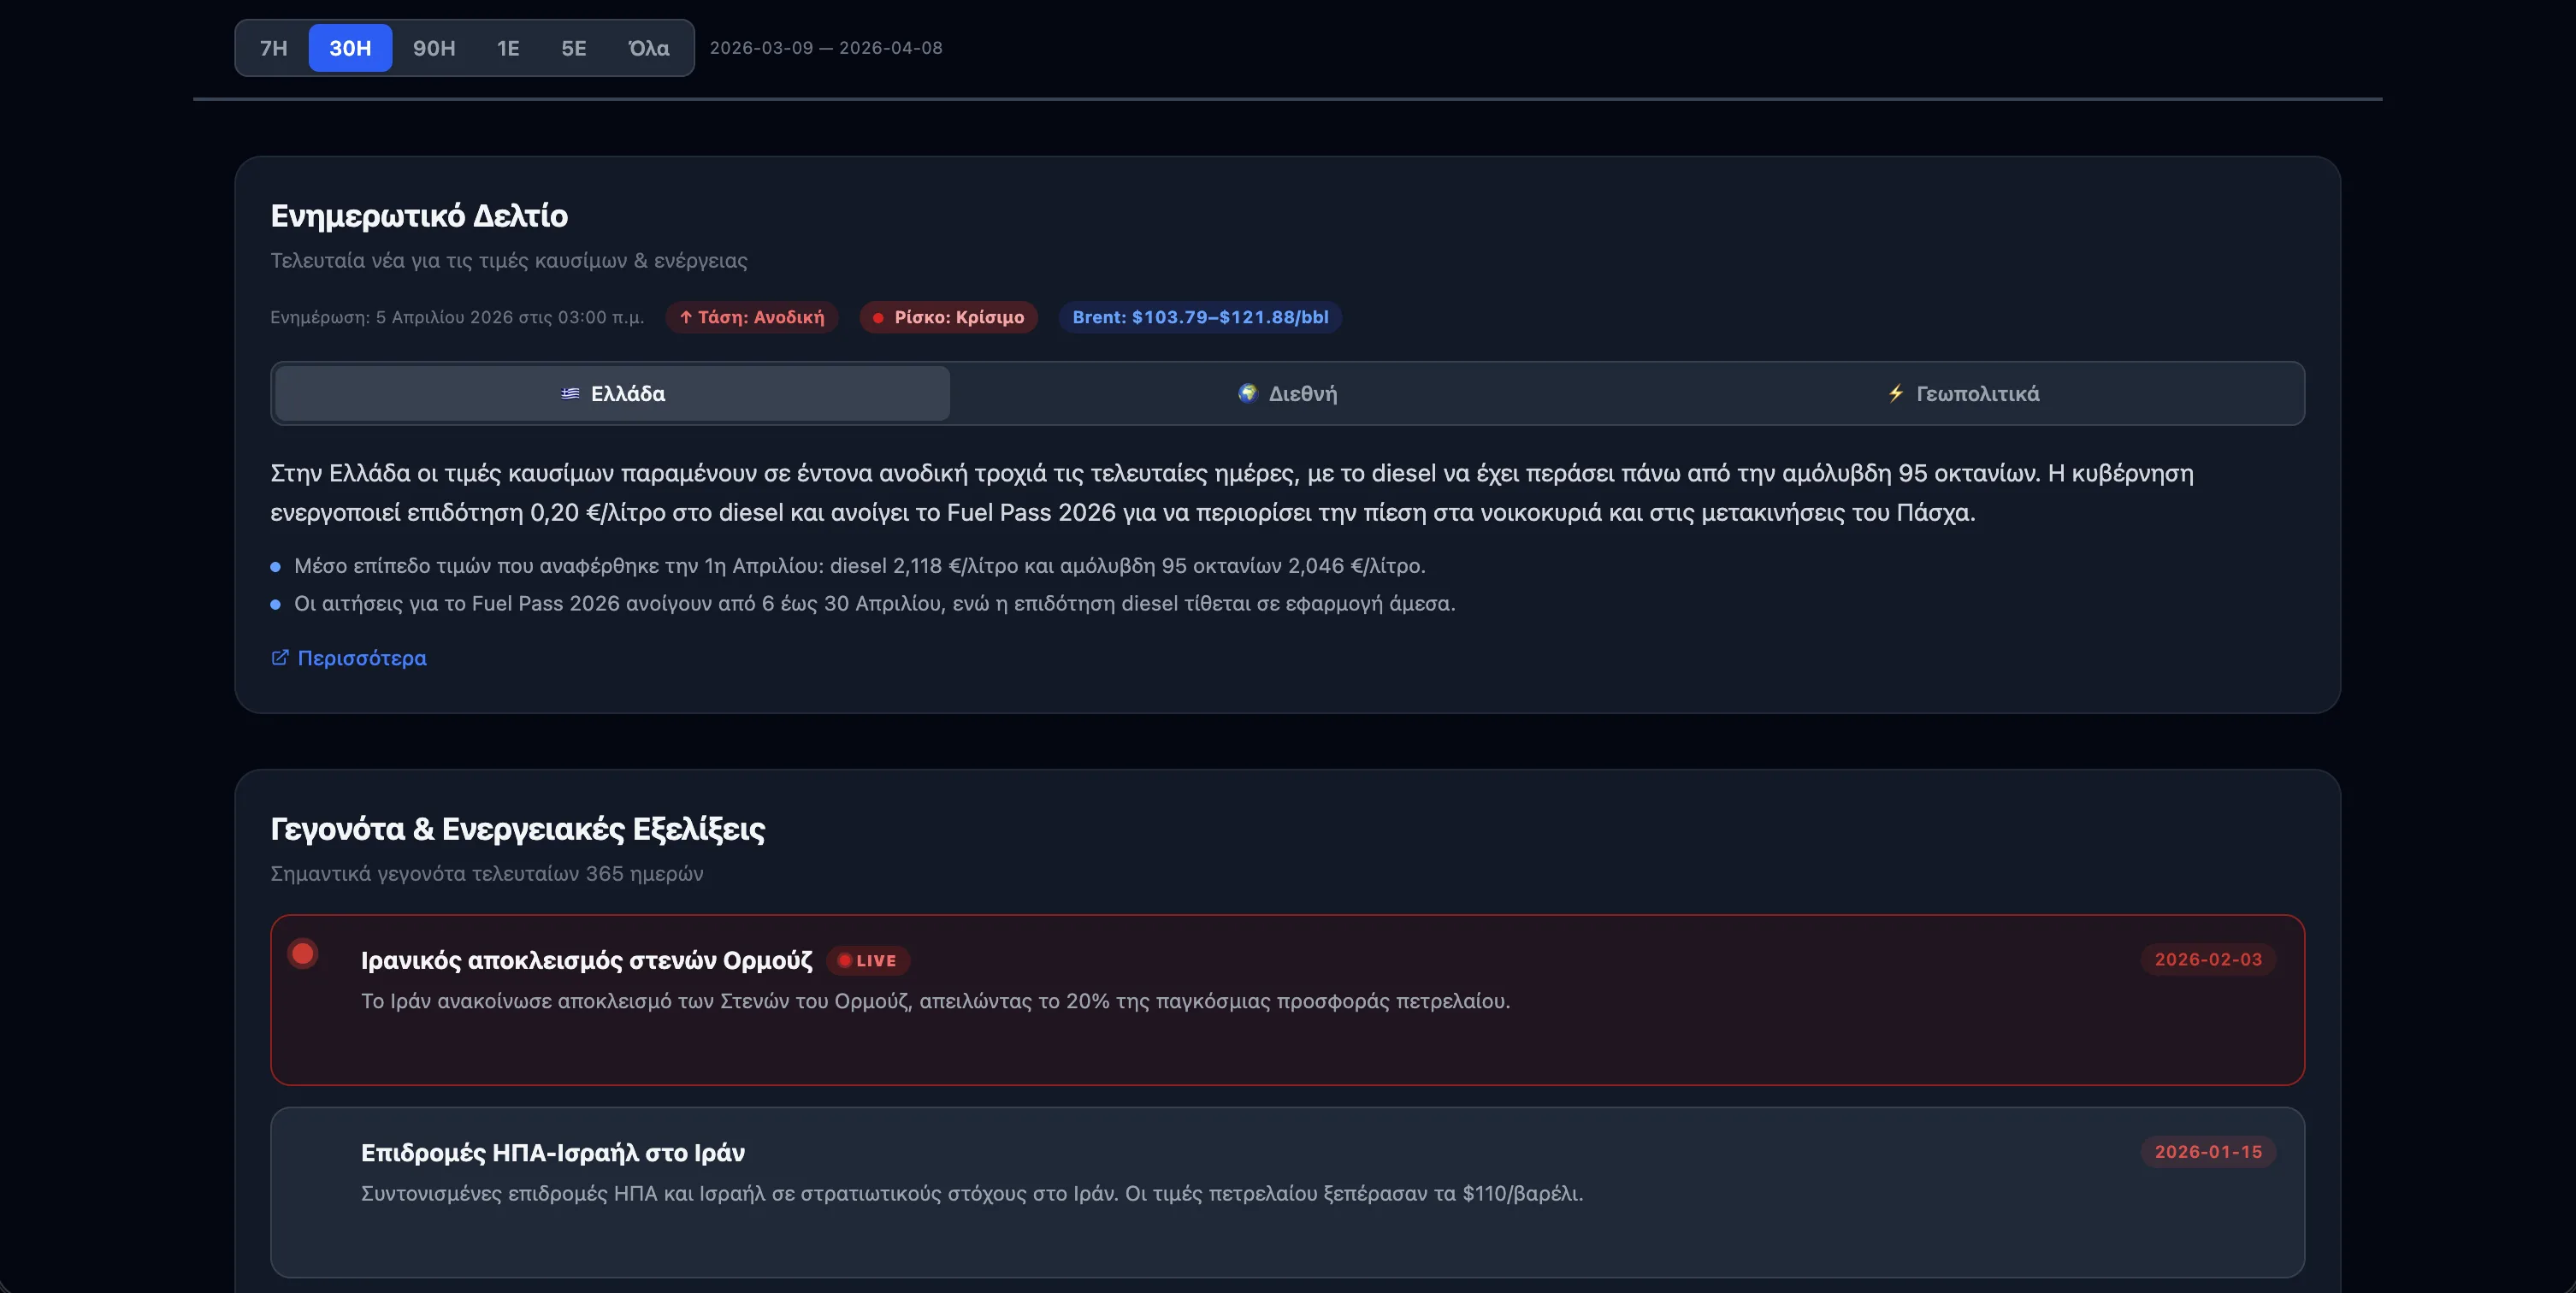
Multi-fuel D3.js line charts overlaid with geopolitical events — Russia-Ukraine, OPEC cuts, tax policy changes — showing real-world price impact.
6+ Years of History
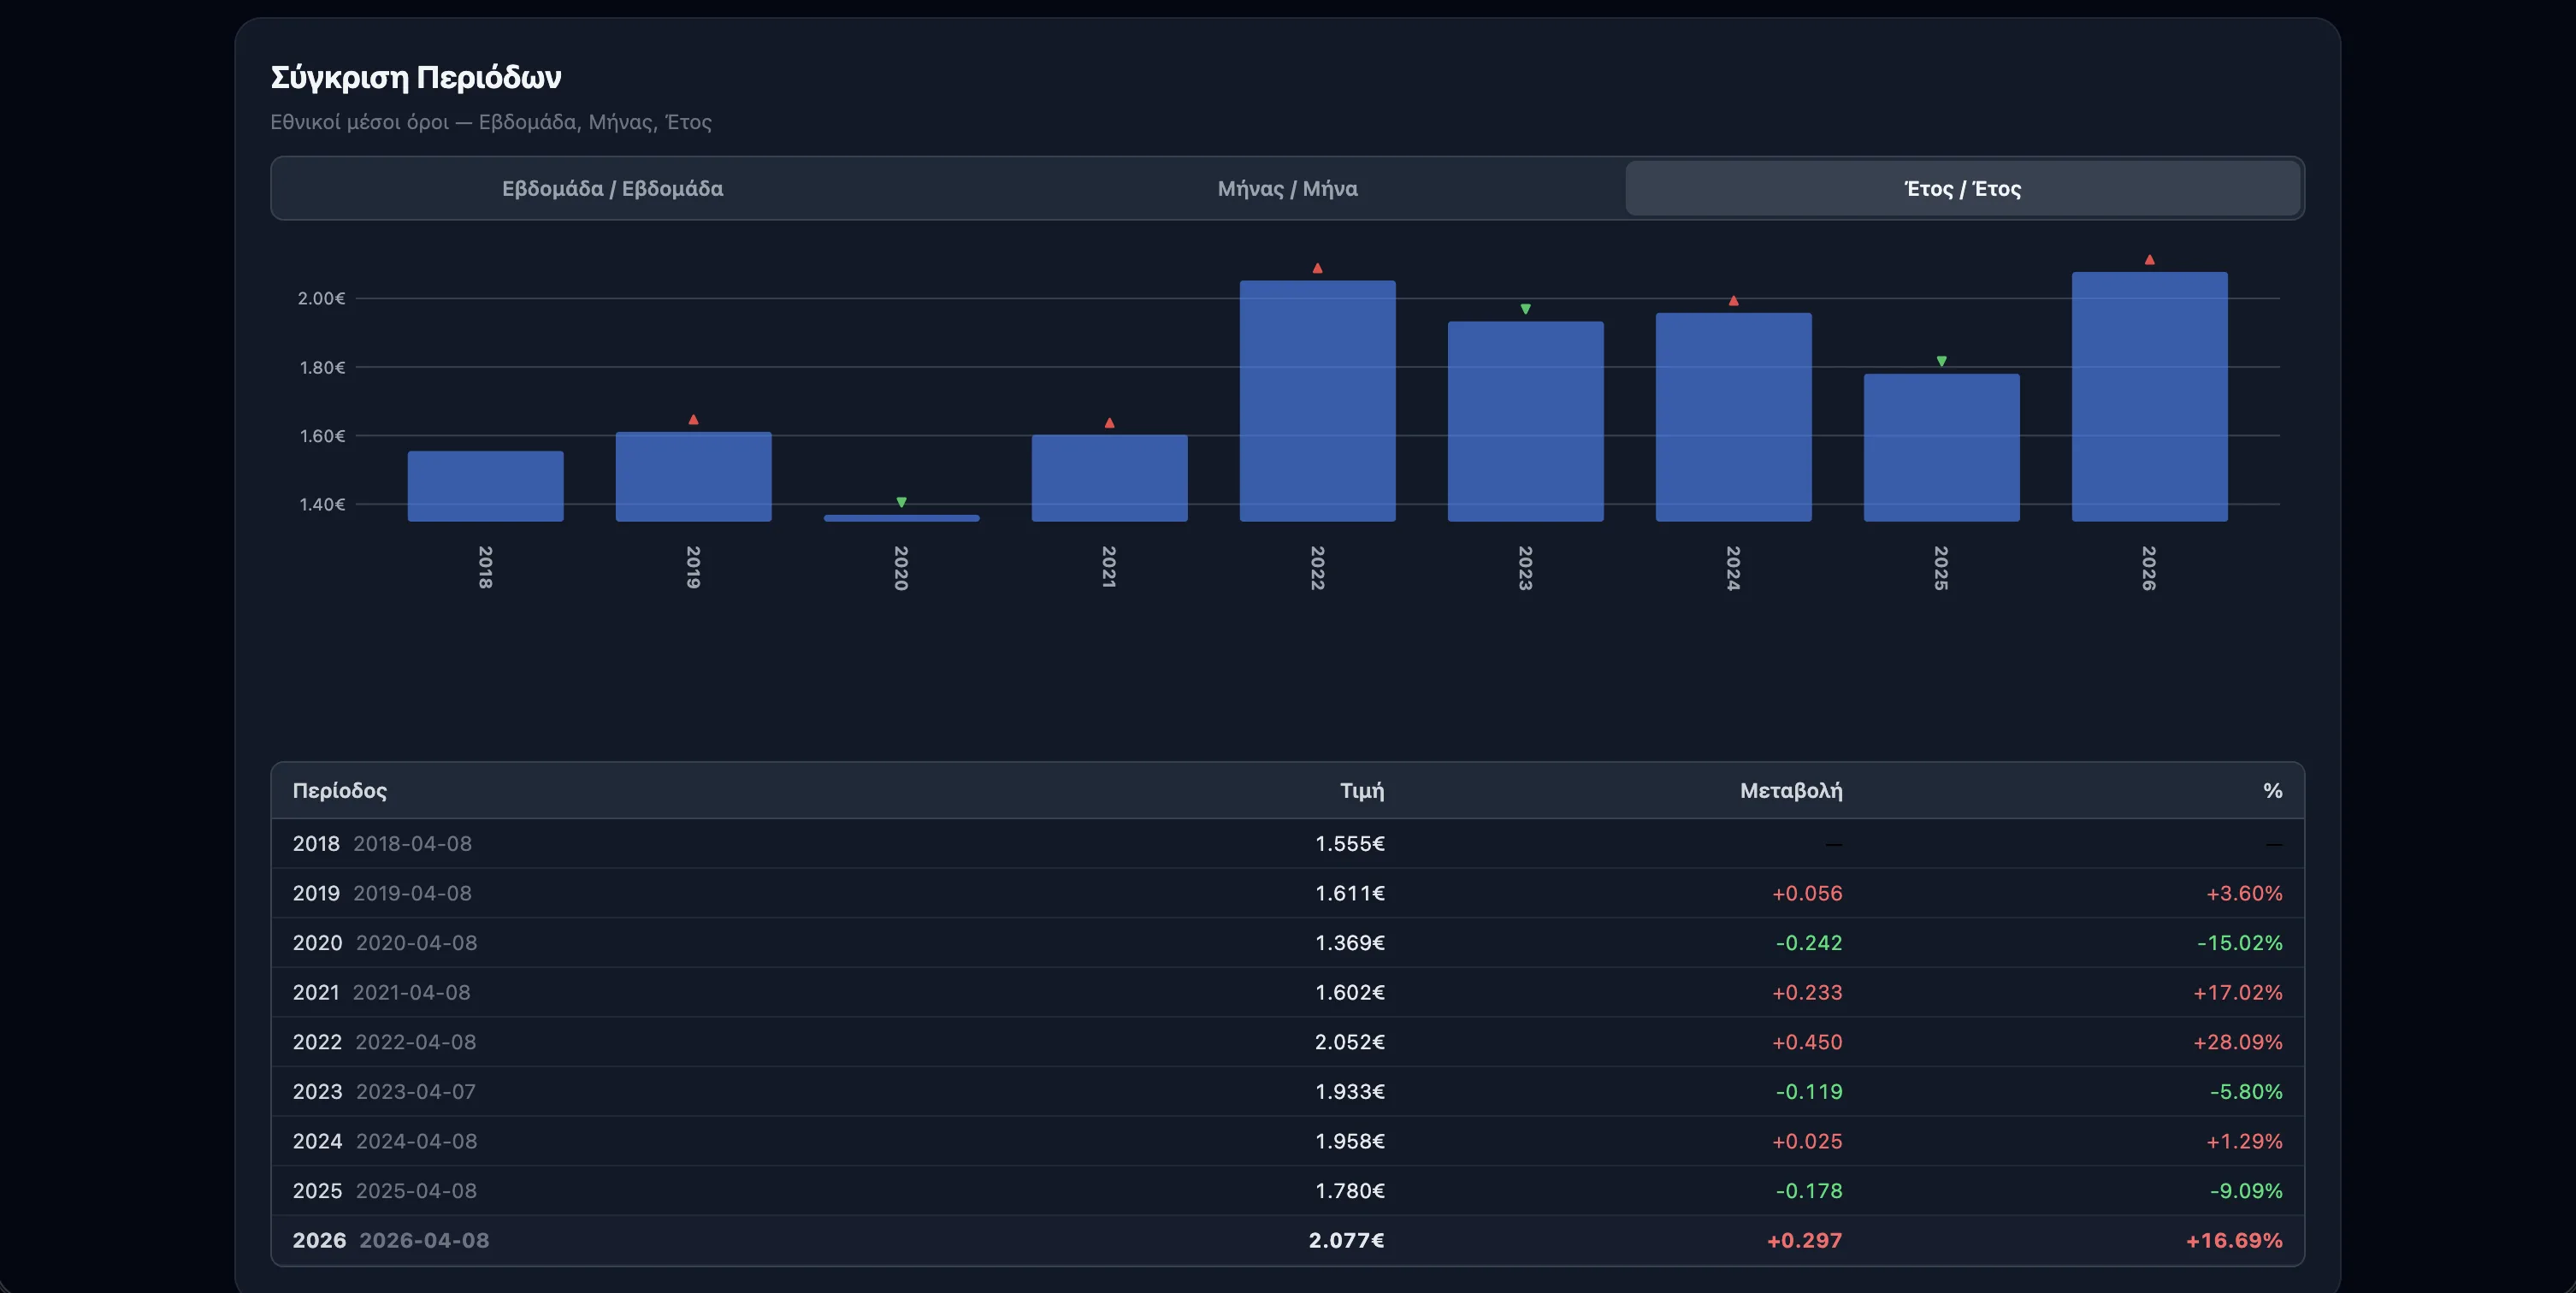
2,900+ daily bulletins since 2018 with smart aggregation — auto-switches between daily, weekly, and monthly views based on date range.
Heatmaps & Seasonality
Price heatmap across regions and dates, seasonal analysis comparing monthly averages across years, and price distribution histograms.
Leaderboards & Insights
Cheapest and most expensive regions ranked daily. Top movers with biggest price swings. Anomaly detection for data quality.
Pipeline
The data pipeline runs daily: a Go downloader fetches new PDF bulletins, an AI vision parser extracts structured pricing data, a TypeScript layer validates and cleans it (handling OCR errors, Greek character encoding, and regional name normalization), and SvelteKit generates a fully static site. The output is pure HTML/CSS/JS — no server needed.
Coverage
Gallery
Takeaways
AI vision is surprisingly good at structured data extraction. Government PDFs with Greek tables are messy, but with strict schema validation and a cleanup layer, the pipeline produces reliable data at scale.
Static sites can handle massive datasets. 66MB of JSON loads fast when you lazy-load by month and let the browser do the work. No servers to scale, no APIs to maintain.
Context makes data meaningful. A price chart is just a line until you overlay the Russia-Ukraine invasion, OPEC production cuts, and Greek tax policy changes. The events timeline turns raw numbers into a story.